day 110-117 2000 (8 days)
day 200-207 2000 (8 days)
day 297-311 2000 (15 days)
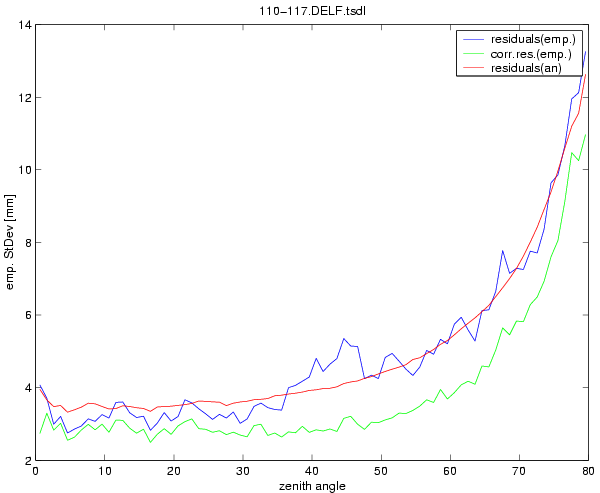
Delft (DELF)
AOA SNR-12 RM
AOAD/M_T DUTD
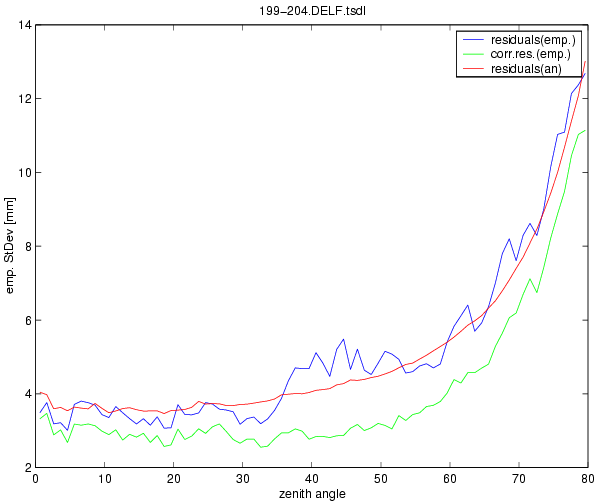
Delft (DELF)
AOA SNR-12 RM
AOAD/M_T DUTD
In Delft the receiver and antenna where changed during the middle of the 2nd period.
In the middle column (to the left) is plotted day 199-204.
In the middle column on the next row is plotted day 206-211.
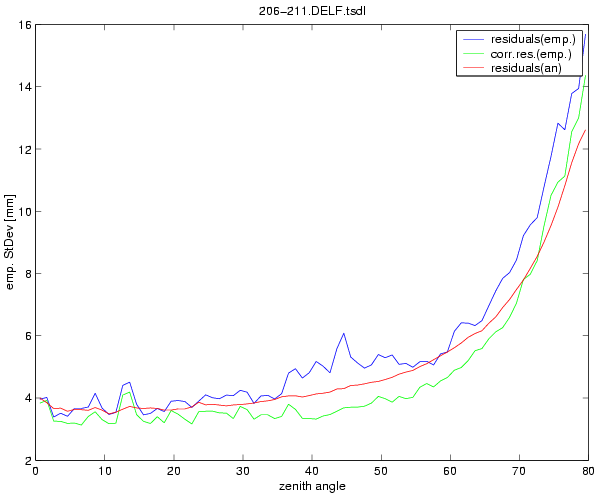
Delft (DELF)
TRIMBLE 4700
TRM29659.00 UNAV
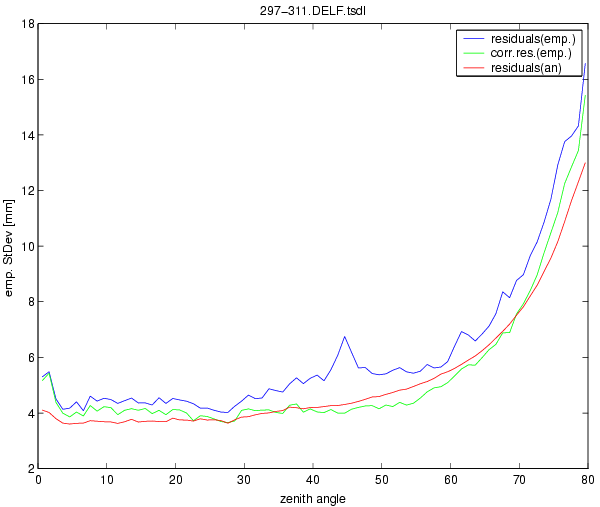
Delft (DELF)
TRIMBLE 4700
TRM29659.00 UNAV
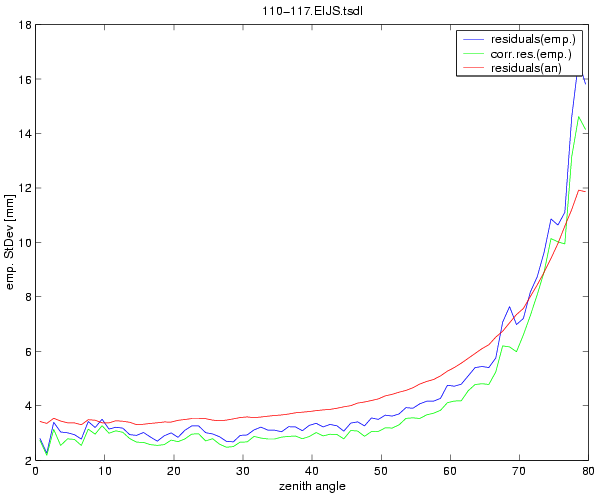
Eijsden (EIJS)
AOA SNR-12 RM
AOAD/M_T DUTD
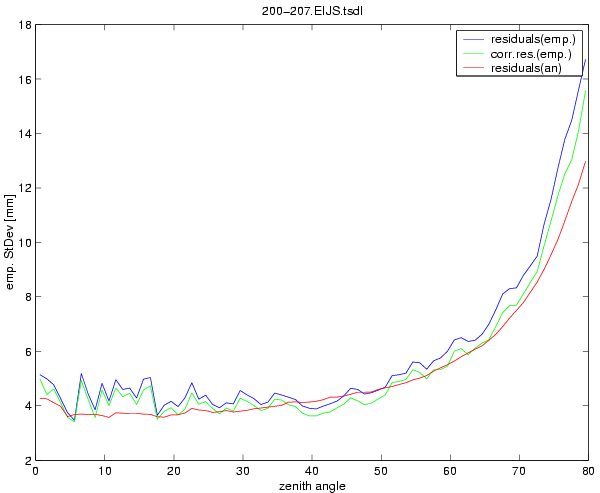
Eijsden (EIJS)
TRIMBLE 4700
TRM29659.00 UNAV
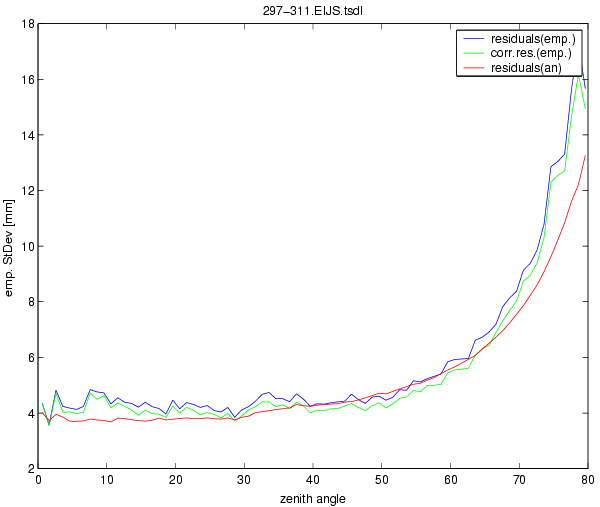
Eijsden (EIJS)
TRIMBLE 4700
TRM29659.00 UNAV
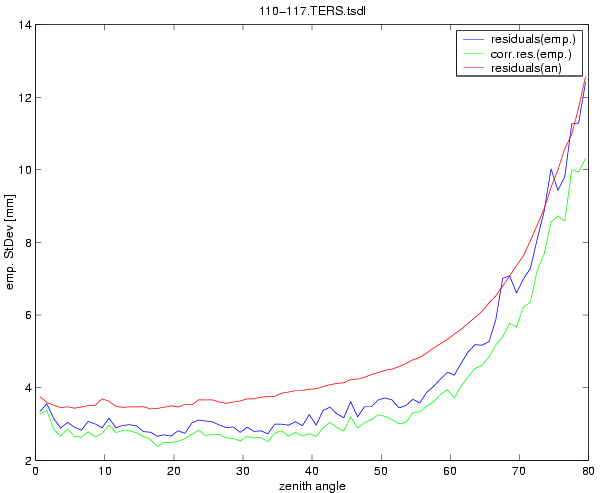
Terschelling (TERS)
AOA SNR-12 RM
AOAD/M_T DUTD
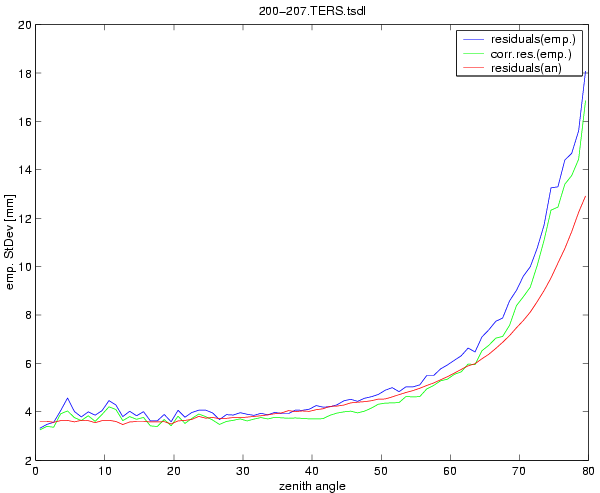
Terschelling (TERS)
TRIMBLE 4700
TRM29659.00 UNAV
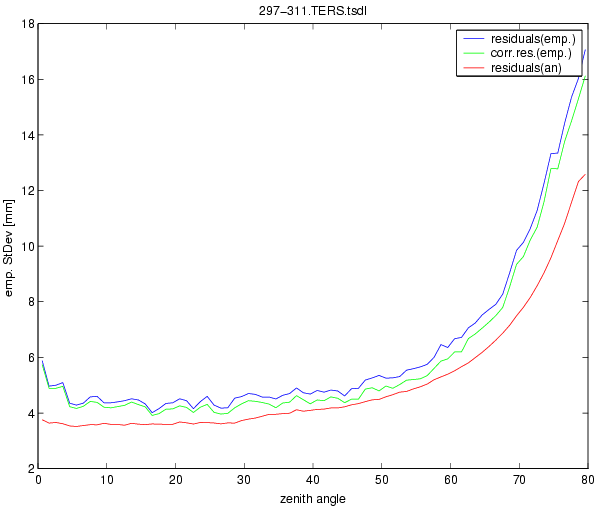
Terschelling (TERS)
TRIMBLE 4700
TRM29659.00 UNAV
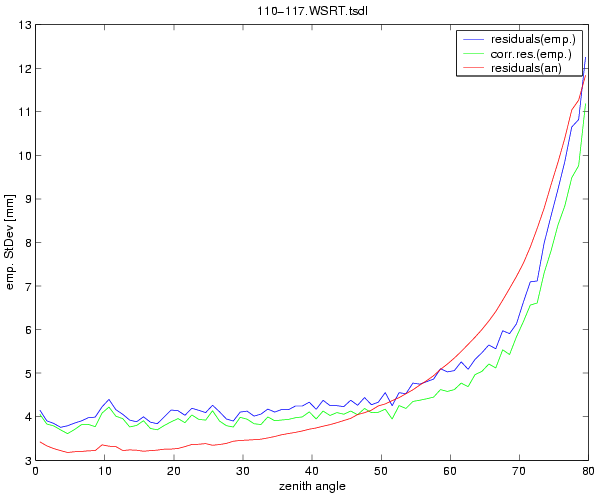
Westerbork IGS (WSRT)
AOA SNR-12 ACT
AOAD/M_T DUTD
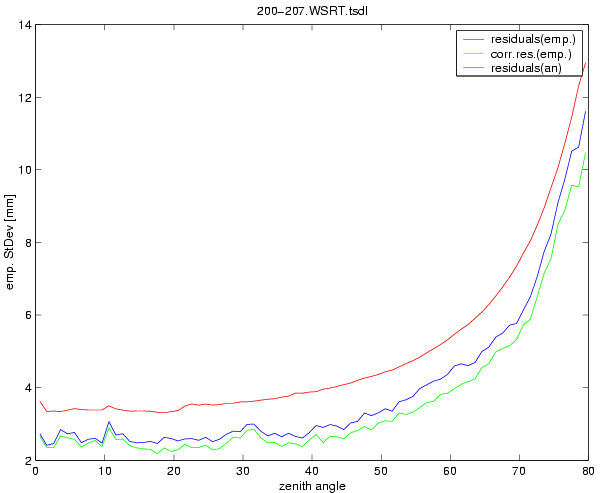
Westerbork IGS (WSRT)
AOA SNR-12 ACT
AOAD/M_T DUTD
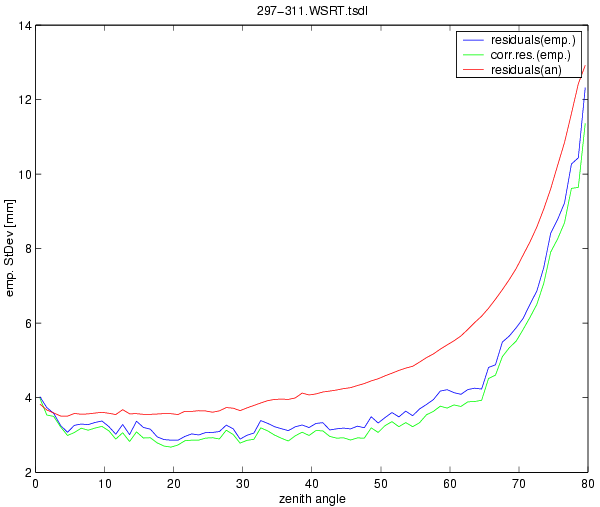
Westerbork IGS (WSRT)
AOA SNR-12 ACT
AOAD/M_T DUTD
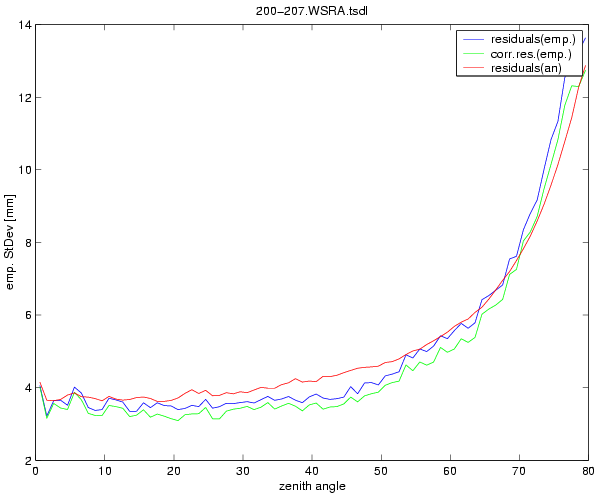
Westerbork AGRS (WSRA)
TRIMBLE 4700
AOAD/M_T DUTD
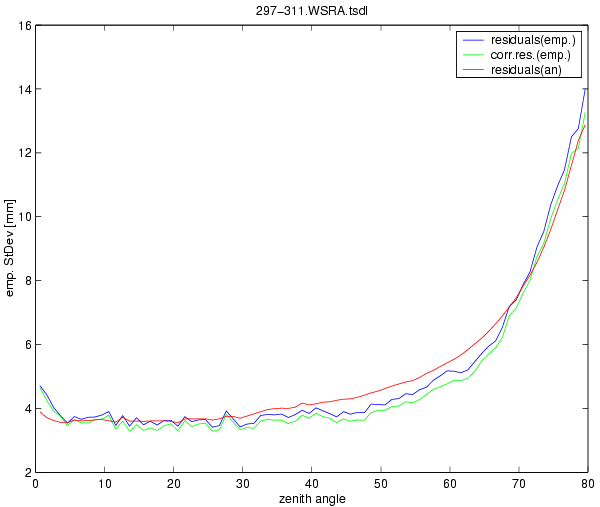
Westerbork AGRS (WSRA)
TRIMBLE 4700
AOAD/M_T DUTD
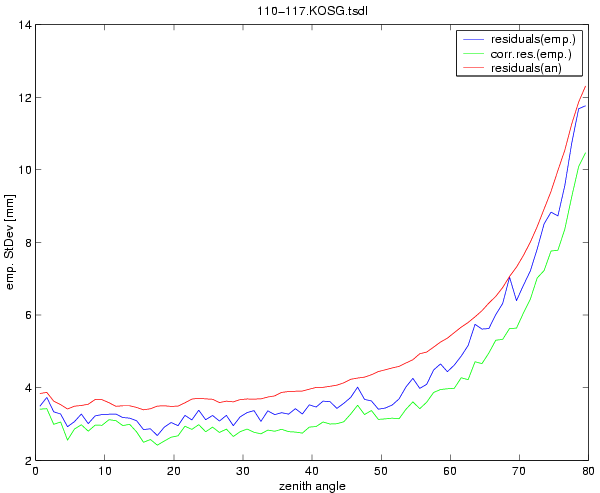
Kootwijk IGS (KOSG)
ROGUE SNR-12 RM
AOAD/M_B DUTD
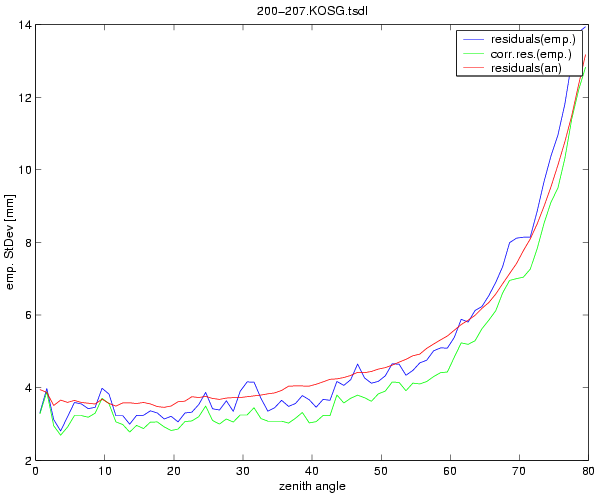
Kootwijk IGS (KOSG)
ROGUE SNR-12 RM
AOAD/M_B DUTD
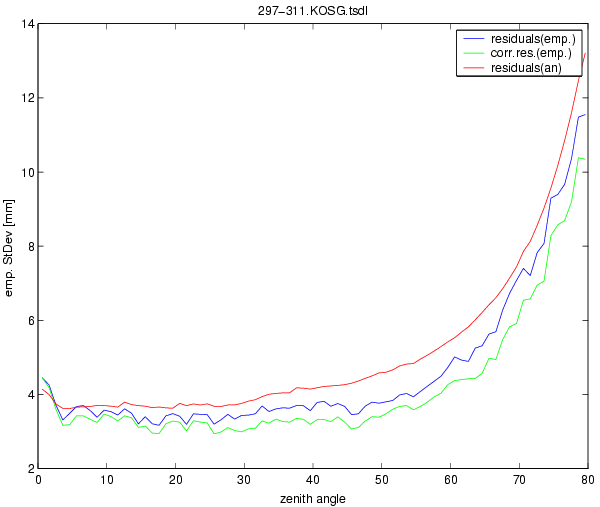
Kootwijk IGS (KOSG)
ROGUE SNR-12 RM
AOAD/M_B DUTD
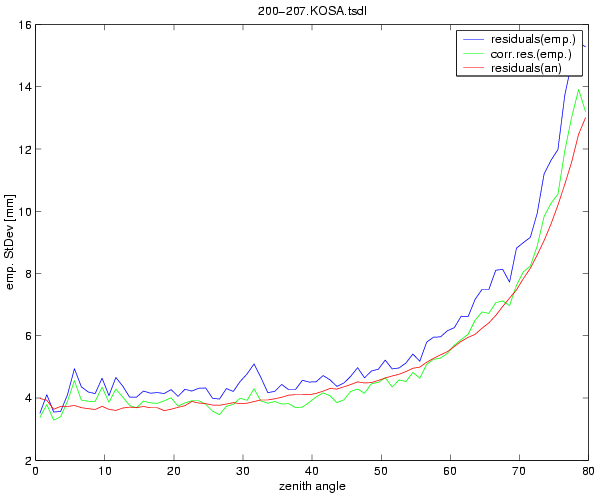
Kootwijk AGRS (KOSA)
TRIMBLE 4700
AOAD/M_B DUTD
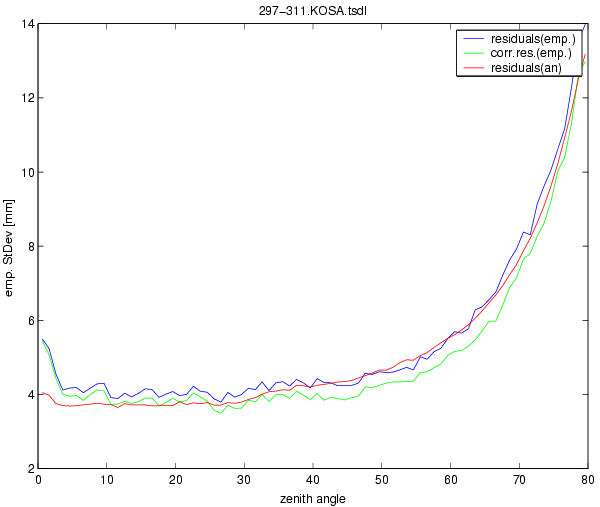
Kootwijk AGRS (KOSA)
TRIMBLE 4700
AOAD/M_B DUTD