Beagle test page TU Delft
This page is for internal use only.
Bert Vermeersen (TU Delft) boarded the Clipper Stad Amsterdam in Perth (Australia) for the
trip to Mauritius. One of the experiments that Bert is supervising on board is the
measurement of the topography of Earth's mean sea-level, or, Geoid. For this
experiment the Clipper Stad Amsterdam carries a high-precision geodetic
GPS receiver which has been supplied by Fugro. This receiver will be able to
measure the sea-level height with an accuracy of about 1 decimeter. The receiver
will continuously track the US Global Positioning Satellites (GPS) and their Russion
cointerpart GLONASS. The receiver will also receive corrections to the GPS and
GLONASS satellite from a geostationary satelliet over the Indian Ocean region in order
to facilitate the high accuracy of the positions. These corrections are computed
by Fugro from a global network of tracking stations.
First results
The GPS receivers and antenna were installed on Monday March 15th. The location
for the antenna was far from ideal; it was mounted on a railing on the "sloependek",
and tracking of the GPS and GLONASS satellites has been very problematic.
The two main problem are that (i) only a very low number of satellites are
being tracked, and (ii) for the satellites that are being tracked there are many
interruptions due to obstructions on deck and the rolling and pitching of the ship.
As a result the position solution often fails due to lack of satellites or
satellites moving in and out the solution. Also, after acquiring a sufficient
number of satellites, it takes at least ten minutes for the position solution
to converge.
Despite these problems the receiver has been collecting data. We were able to
downloaded three days of data, until Thursday May 18th, when - as announced - the
Internet connection to the Clipper Stad Amsterdam was lost. From these three
days of data we have been able to compute ten geoid heights.
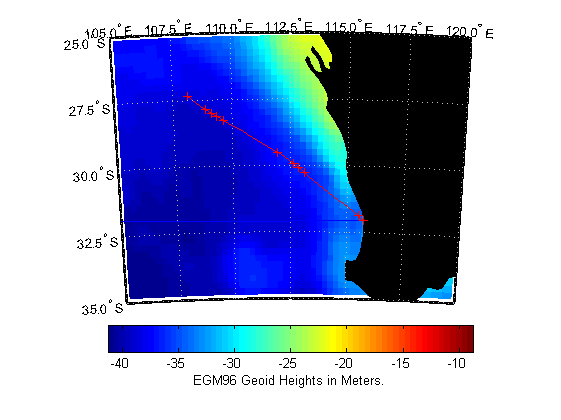
This figure on the left shows the color codes EGM96 geoid heights near the coast of
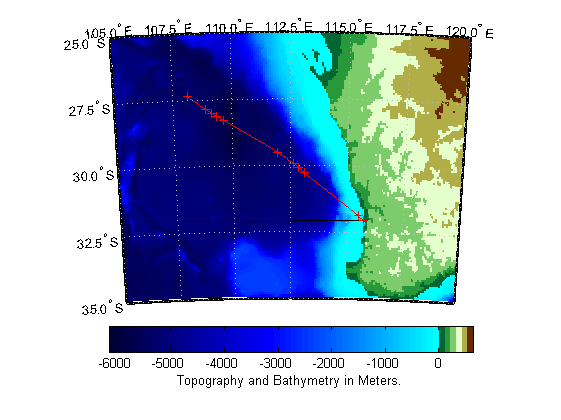
Western Australia. The figure on the right shows the bathymetry and topography near the coast of Western Australia. The track
of the Clipper Stad Amsterdam is shown in red.
The positions were the Clipper Stad Amsterdam has taken
GPS height measurements are indicated by crosses. The great-circle route
between Perth and Mauritius is shown as well. Clearly, the clipper is taken a more
northerly route in order to pick up the favourable trade winds.
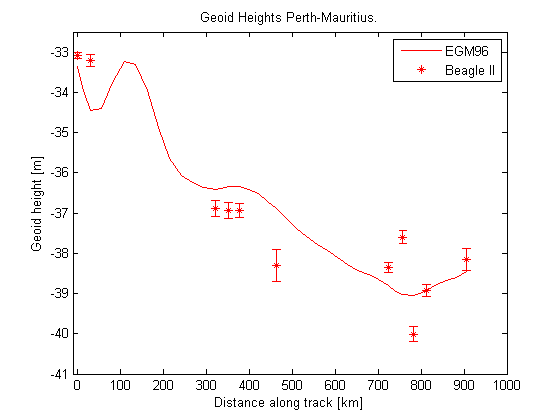
This figure shows geoid height as obtained from the GPS measurements on
board the Clipper Stad Amsterdam (Beagle II) with error bars, and compares these
to the EGM96 model geoid height.
How do we interpret these measurements?
The differences between the GPS measured Geoid heights on board the Clipper
Stad Amsterdam and the model Geoid heights can be explained as follows
- Errors in the GPS measurements and motion of the ship.
These are indicated by the error bars in the plot.
Certainly the GPS measurement errors are a little bigger than
we would have liked because of the tracking problems, but the motion
of the ship is causing the biggest uncertainty here. In order to reduce
this error we average GPS measurements over a period of about one hour.
We do not yet correct for the pitch and roll (but this is planned). However,
this is a relatively minor effect compared to the actual motion of the ship.
- Error in the model geoid height. The EGM96 is far from perfect and is just
a simple geoid model. This is just a first - quick - comparison. There
are ohter, much better and more recent, geoid models from recent and
on-going satellite missions. We will include these in later
comparisons. The error in the model geoid height is the main cause for
the differences.
- Ocean tides and currents. We haven't corrected for these. On the contrary,
these should have become "visible" as periodieke effects for the ocean
tides and lumps for the currents only if we would have had sufficient
and almost continuous GPS tracking. It is in this area that the
poor performance of the GPS hurts most.
If the GPS would have performed better would have had a continuous line
with measured geoid and dynamic ocean heights instead of the few individual
points we have now.
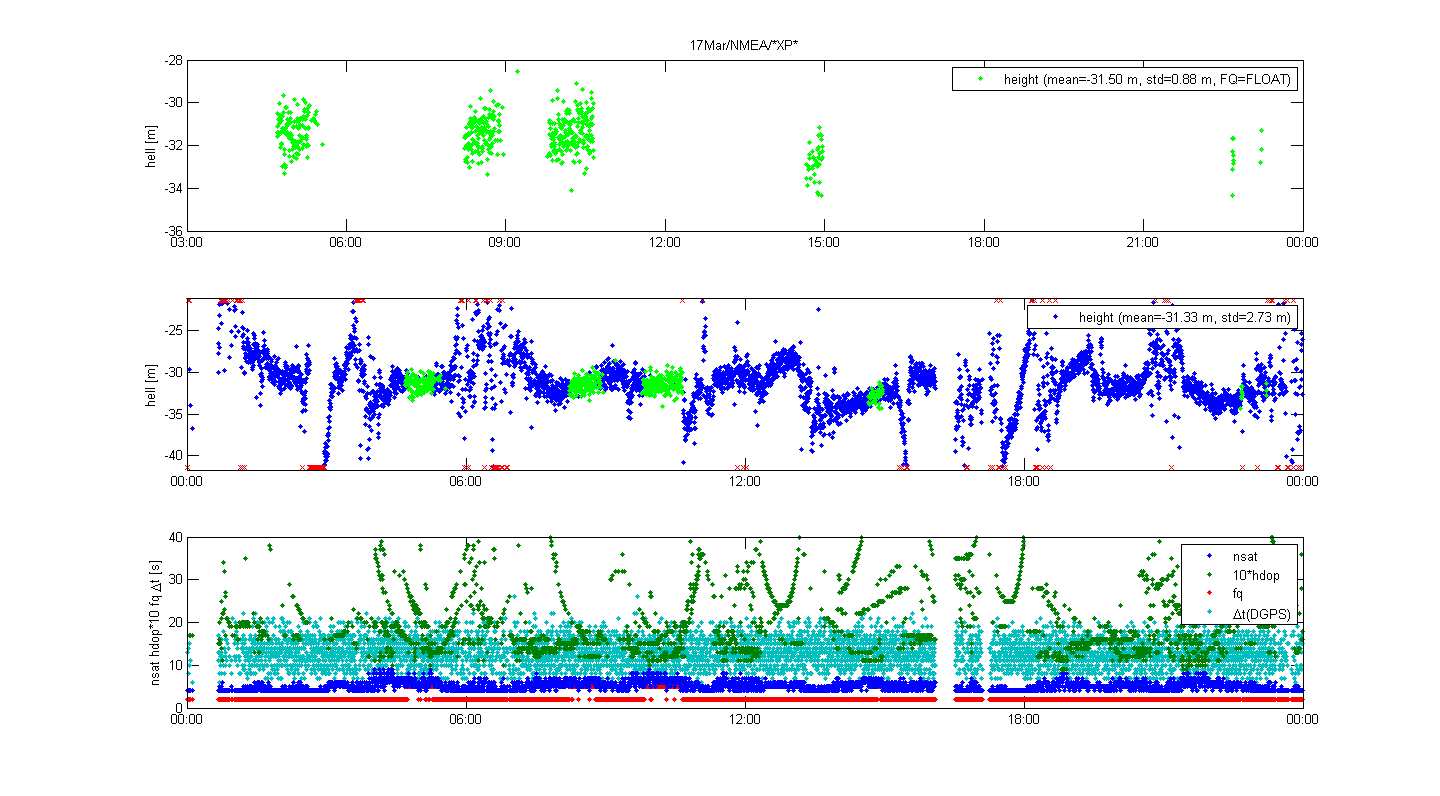
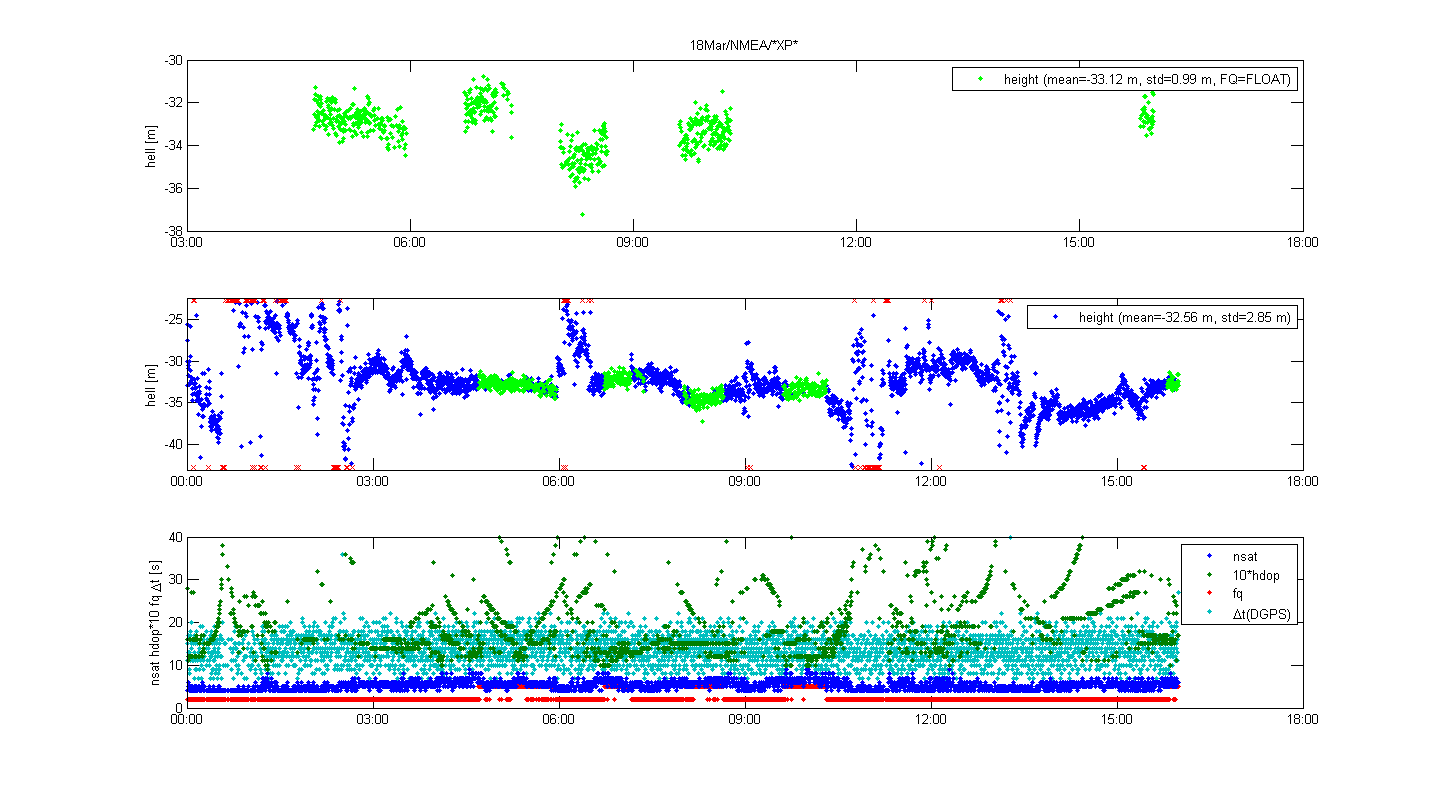
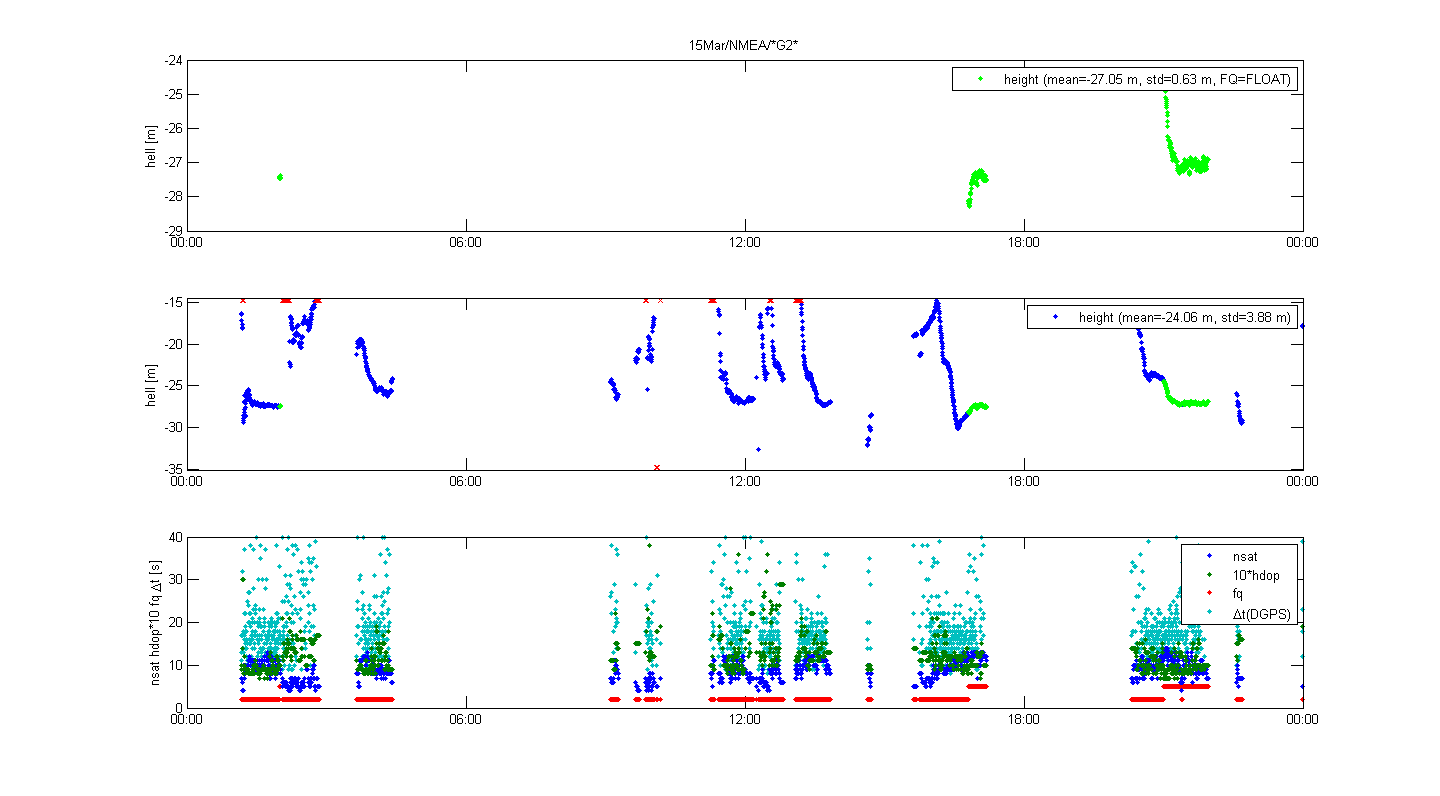
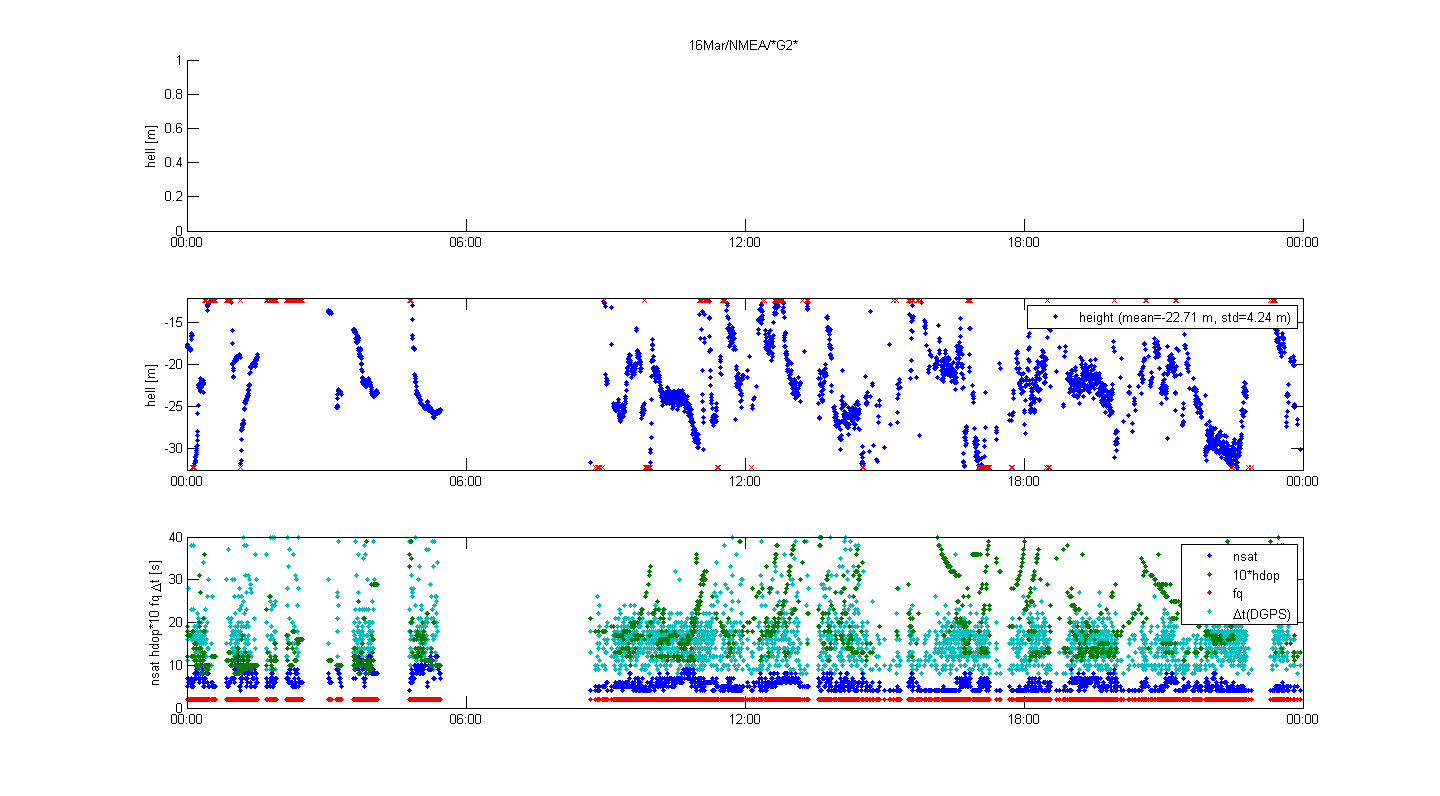
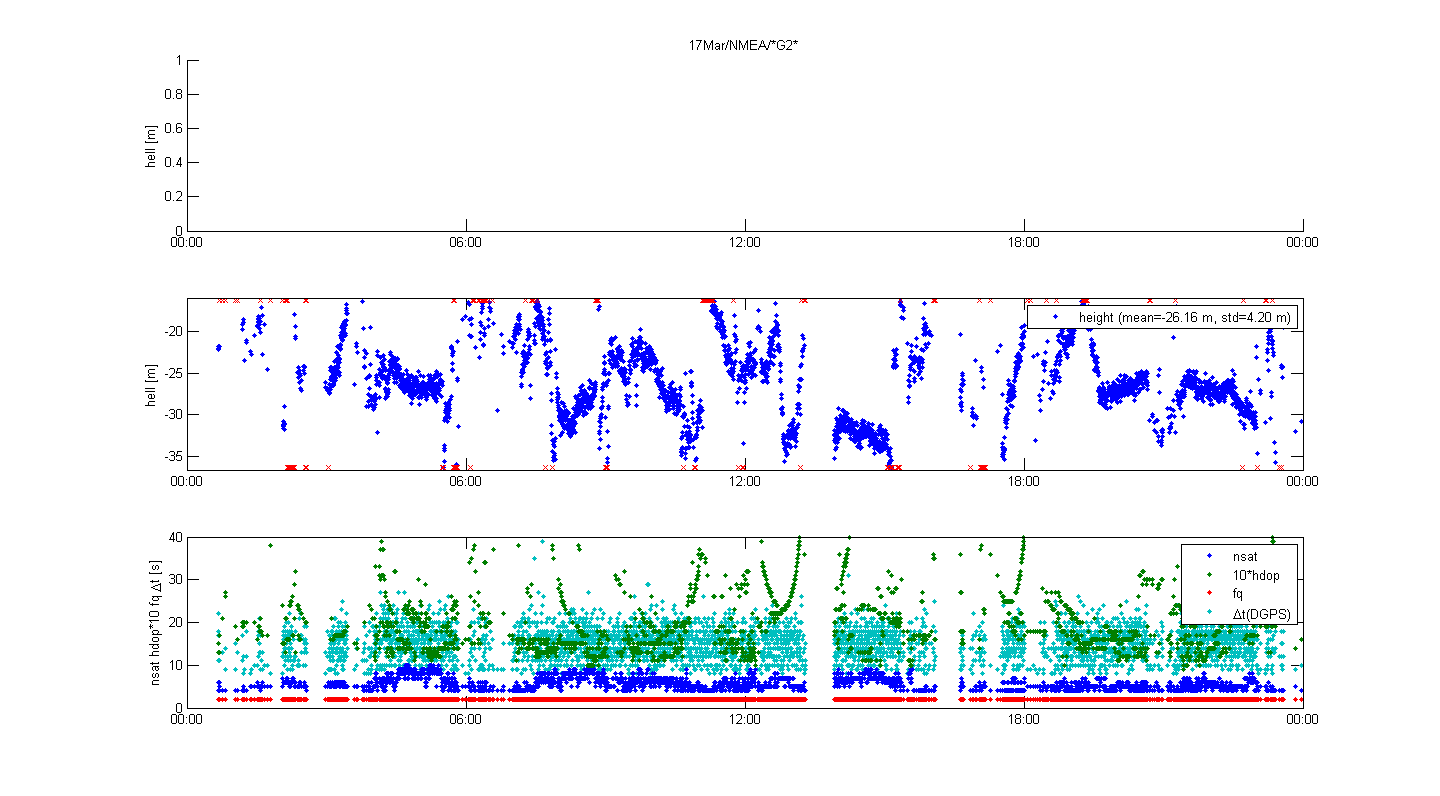
GPS+GLONASS tracking results
Those we are interested in the raw GPS position data can have a look at
the following plots for the XP (GPS only) and G2 (GPS+GLONASS) services
15mar_xp.png,
16mar_xp.png,
17mar_xp.png,
18mar_xp.png,
15mar_g2.png,
16mar_g2.png,
17mar_g2.png and
18mar_g2.png.
The position solutions that were used in the computation of geoid height
are shown in green. The standard deviation which is given for the position
solutions is also affected by the motion of the ship. It is clear from
these plots that the number of satellites being tracked is very low, we should
have almost the double number of what we are tracking now, and also GLONASS
is not helping (actually the G2 solutions are worse than the XP).
Can we further improve the GPS results?
Of course, a better location for the GPS+GLONASS antenna could solve
some of these problems. However, it is a sailing ship, and there are always
mast and other obstructions, but for sure, a better position could have been
found. Unfortunaly, we were severely restricted in our choice for the
antenna location due to the availability of wiring. It is unlikely that we
can change the antenna position.
Post-processing of the data could help. The raw measurements are stored
and better results could be obtained from post-processing as compared to
the real-time processing on board. However, don't expect wonders, as this
will not solve the tracking problems.
Finally, in the current processing only measurements for which we have
a carrier phase solution (FQ=5, FLOAT) were included. If the less accurate
DGPS position, using the code only (FQ=2), is included we would get more
data points.
Geoid and bathymetry along the route for Perth to Mauritius
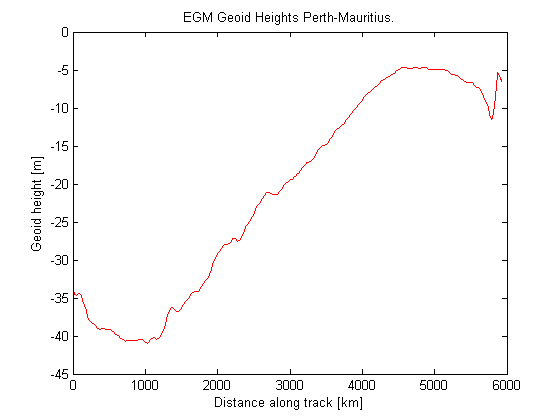
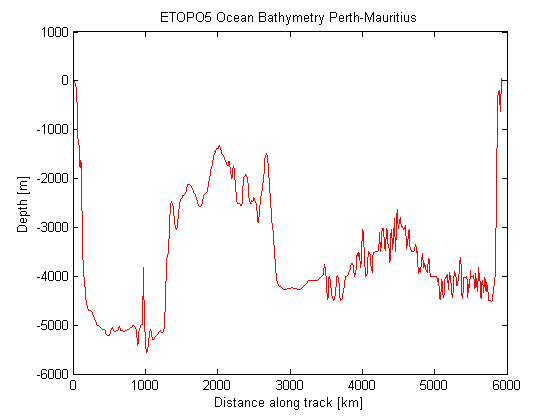
EGM96 Geoid Heights (left) and bathymetry (right) along the great-circle route
from Perth to Mauritius.
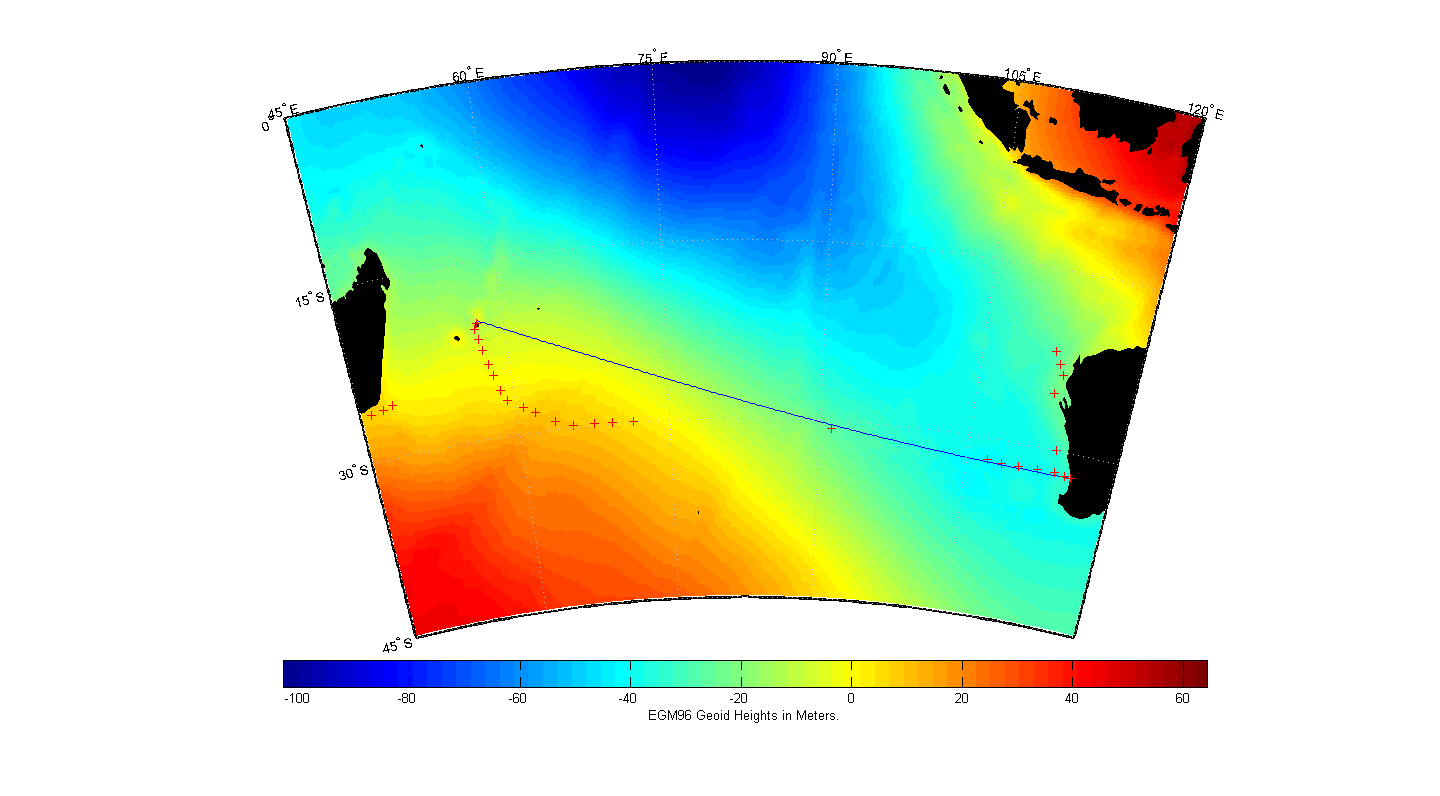
EGM96 Geoid Heights for the Indian Ocean region. The great-circle route
between Perth and Mauritius is shown in black. The Geoid Heights along this
track have been plotted in the previous figure.
The crosses are the positions Vening Meinesz took
gravity measurements with the K18.
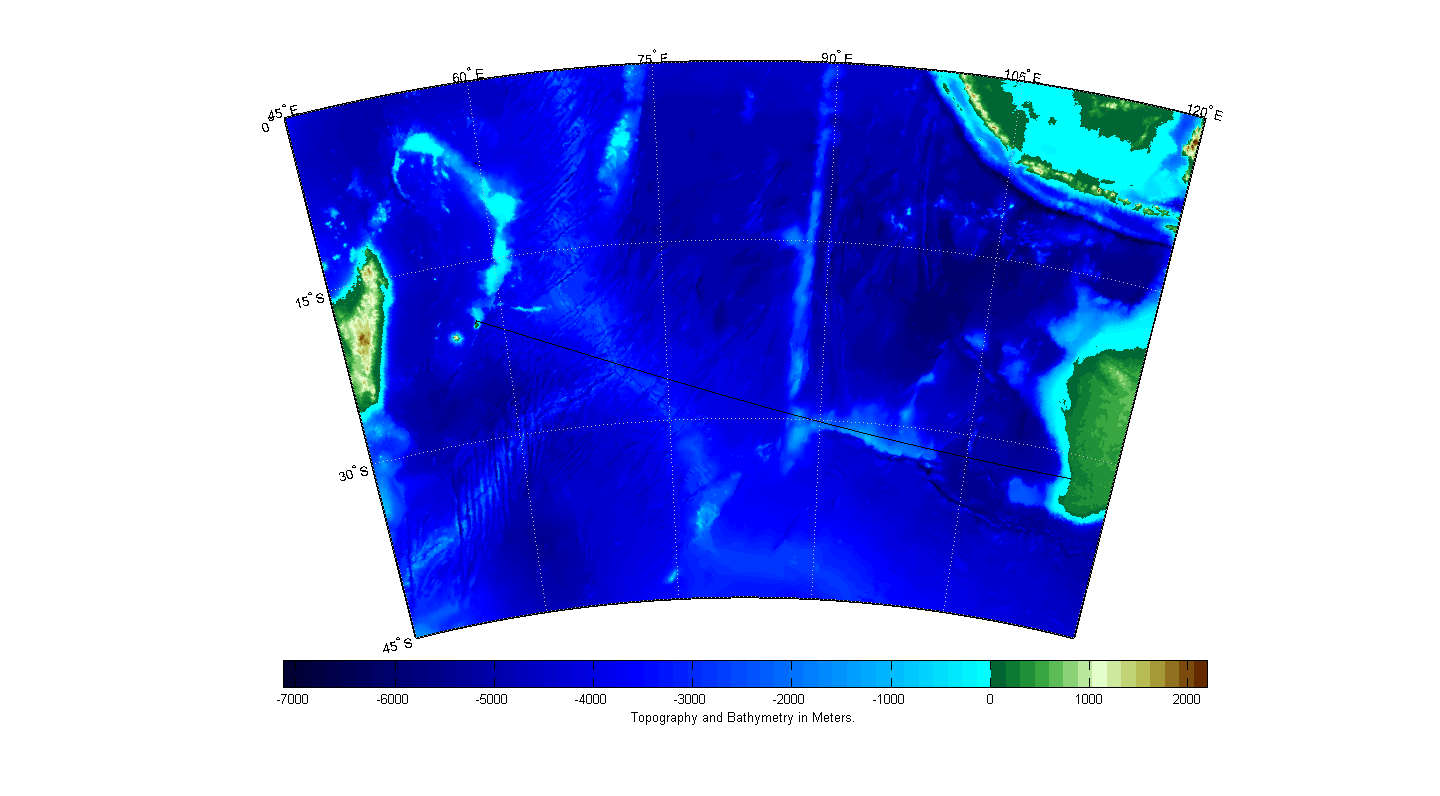
Bathymetry and topography of the Indian Ocean region (ETOPO5). The great-circle route
between Perth and Mauritius is shown in black. The bathymetry along this track
have been plotted in the previous figure.
Test of Fugro GPS data
The GPS receiver on board the Clipper Stad Amsterdam has been supplied by Fugro.
This is dual frequency L1/L2 GPS and GLONASS receiver based on the NovAtel
OEM5 board. The receiver will also receive propriatory correction messages
from a geostationary satellite. These corrections are computed
by Fugro from a global network of tracking stations. The receiver will provide two
services: XP with GPS only, and G2 with GPS and Glonass.
24 hour test dataset
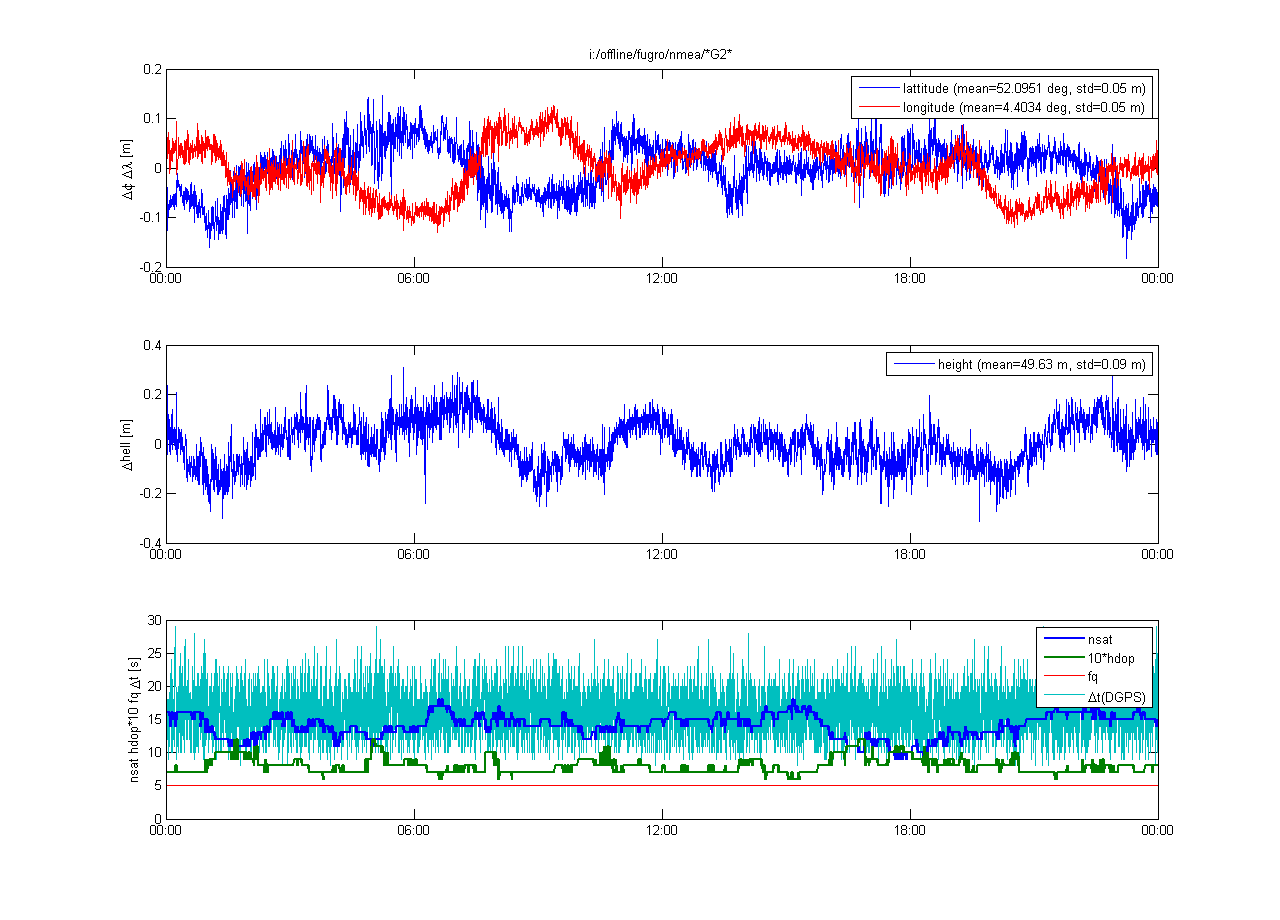
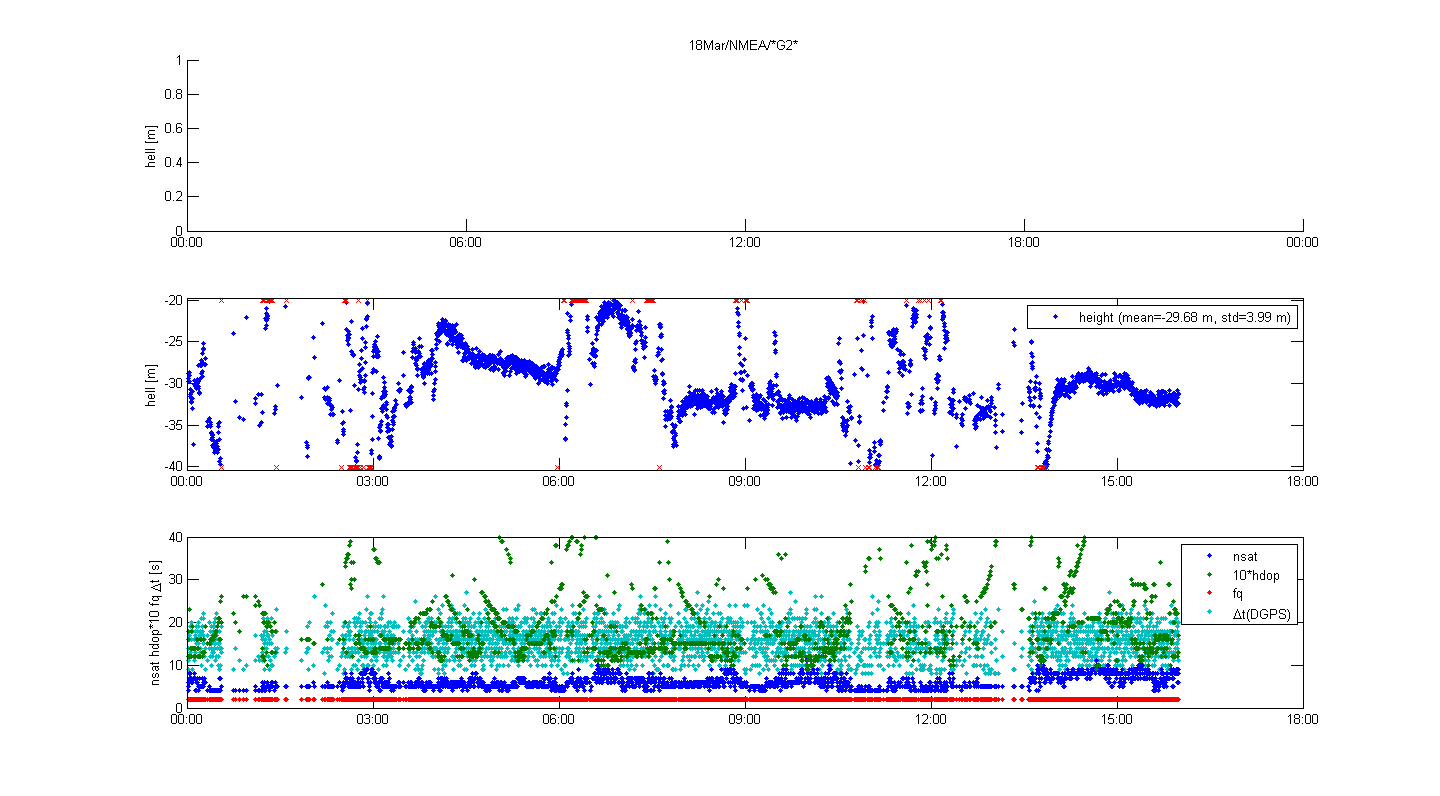
Results for Fugro G2 service (GPS and GLONASS). The top plots shows the
position differences with respect to the mean. The receiver is at rest. The
middle plot shows the height above the international reference ellipsoid.
The bottom plot shows the number of satellites, horizontal DOP (Dillution
of Precision), latency of the G2 corrections and solution quality (fq).
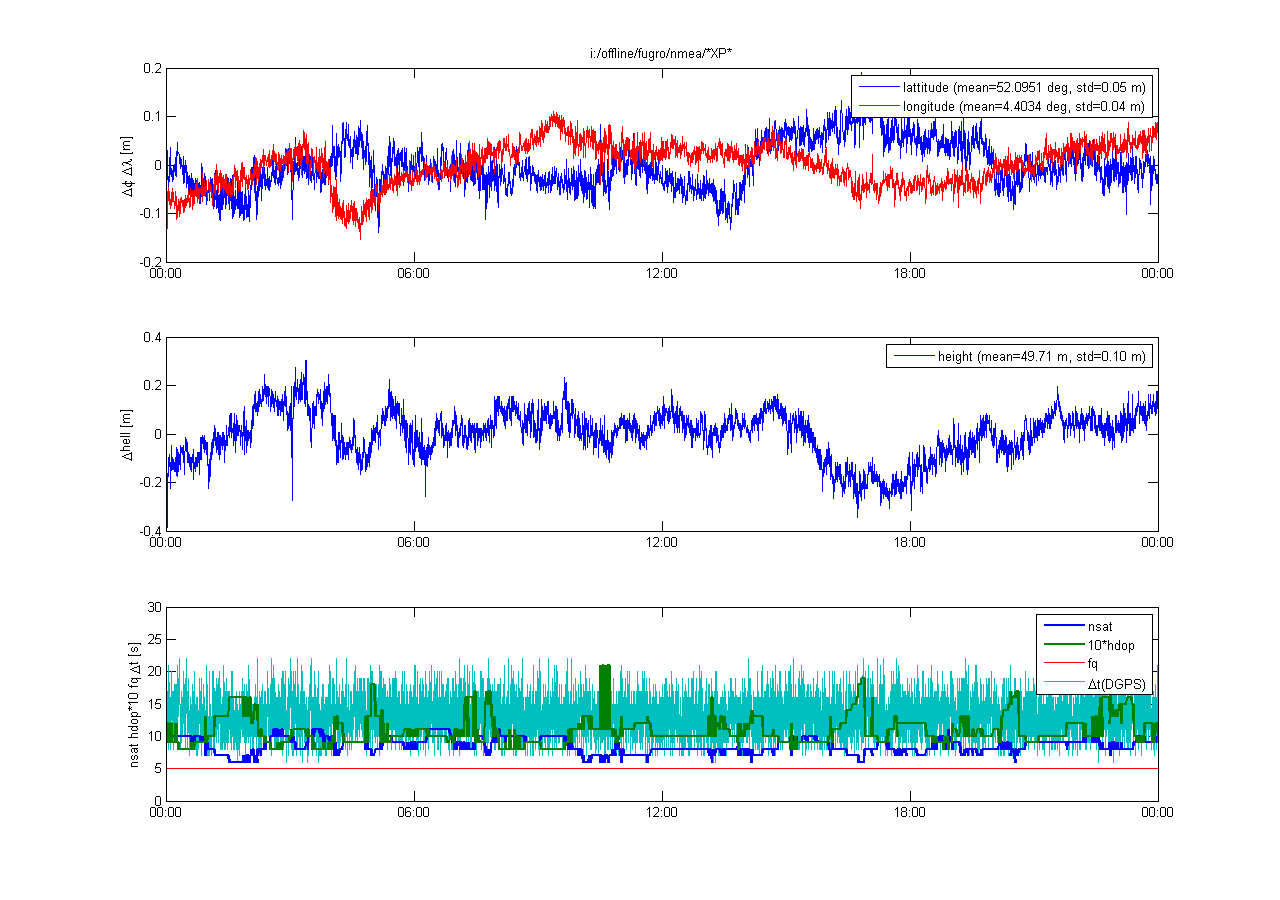
Results for Fugro XP service (GPS only). The top plots shows the
position differences with respect to the mean. The receiver is at rest. The
middle plot shows the height above the international reference ellipsoid.
The bottom plot shows the number of satellites, horizontal DOP (Dillution
of Precision), latency of the G2 corrections and solution quality (fq).
2 hour test dataset
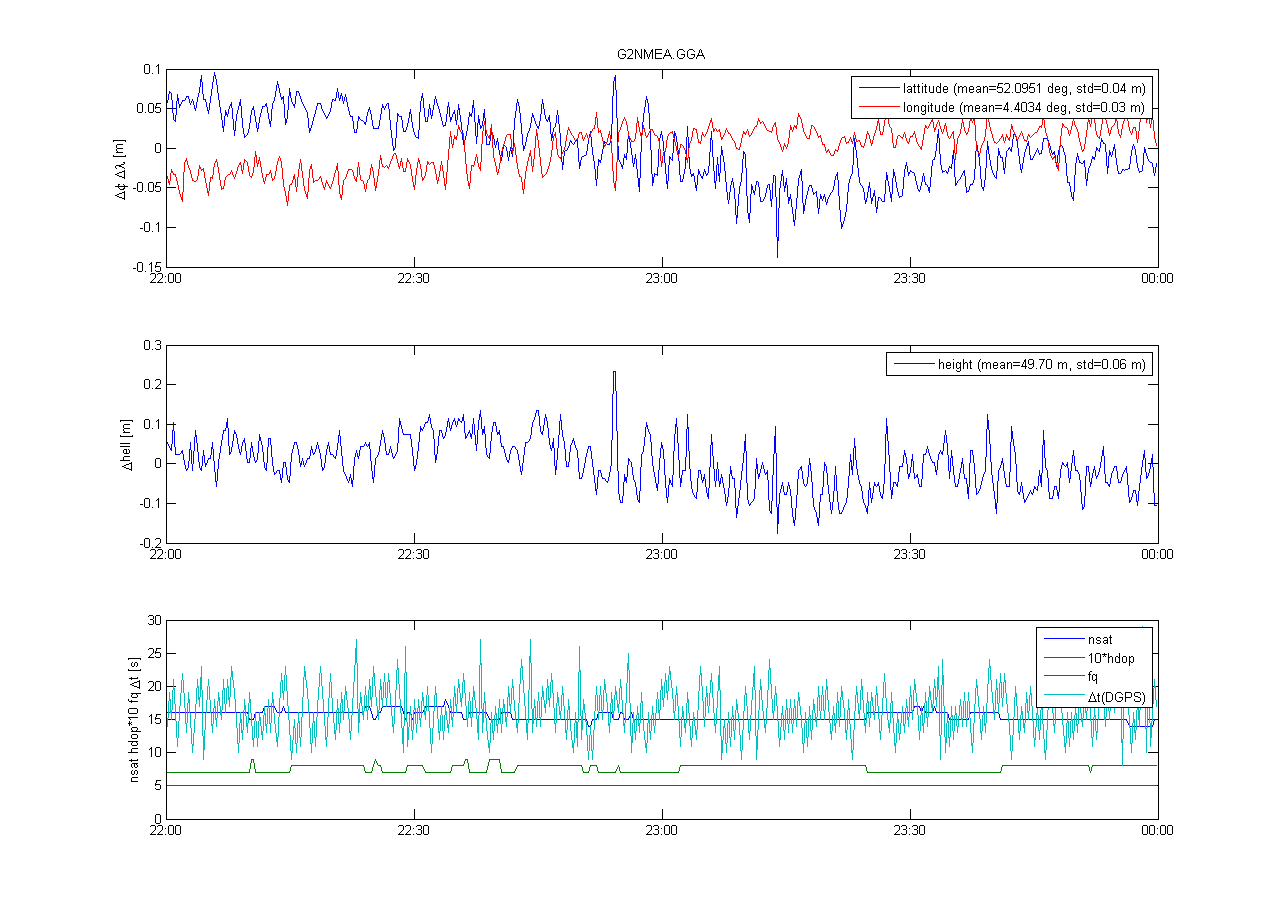
Results for Fugro G2 service (GPS and GLONASS). The top plots shows the
position differences with respect to the mean. The receiver is at rest. The
middle plot shows the height above the international reference ellipsoid.
The bottom plot shows the number of satellites, horizontal DOP (Dillution
of Precision), latency of the G2 corrections and solution quality (fq).
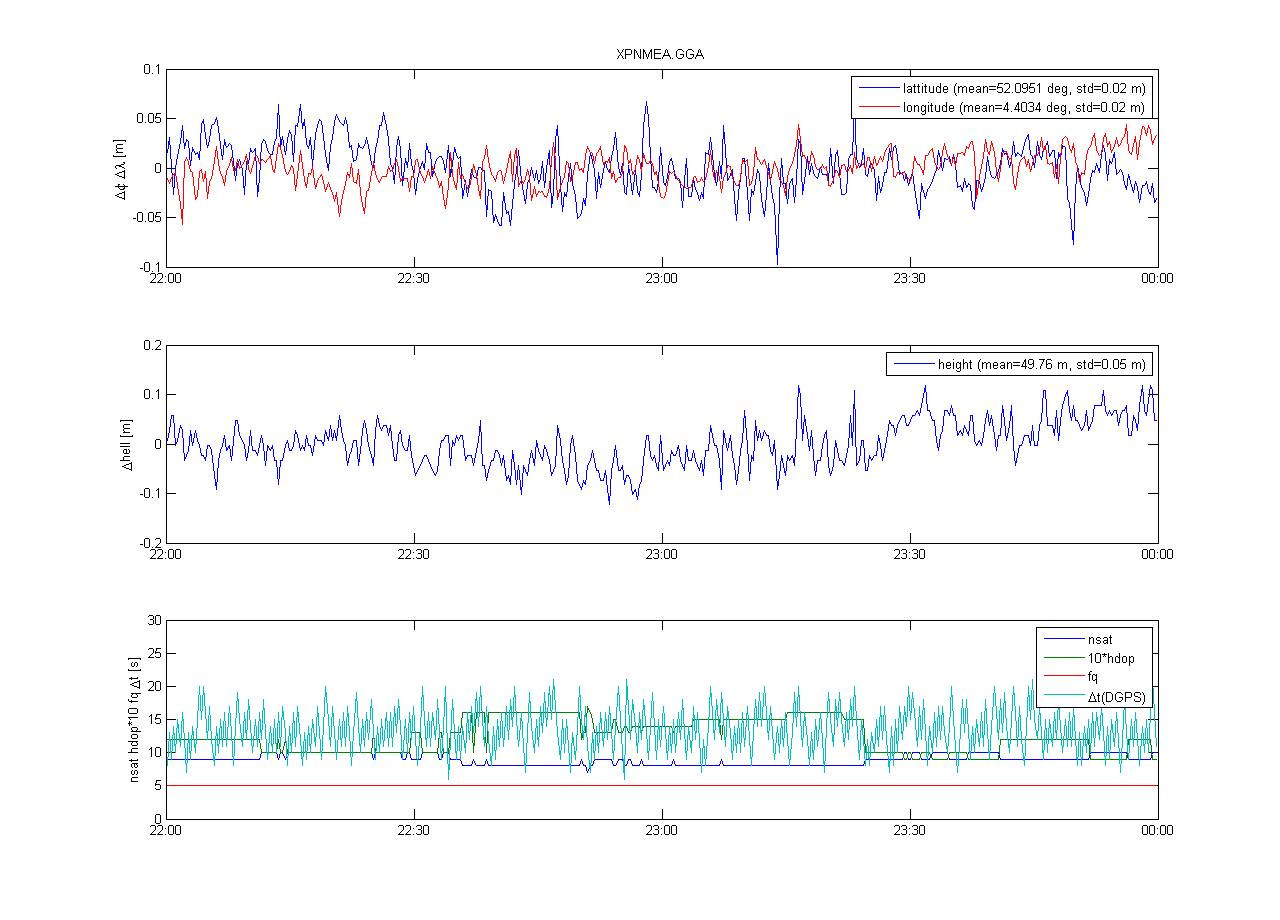
Results for Fugro XP service (GPS only). The top plots shows the
position differences with respect to the mean. The receiver is at rest. The
middle plot shows the height above the international reference ellipsoid.
The bottom plot shows the number of satellites, horizontal DOP (Dillution
of Precision), latency of the G2 corrections and solution quality (fq).
Files
The matlab scripts used to produce the plots on this page can be found in the
directory ./matlab. The test data is located in
the directory ./testdata. The data collected
during the trip can be found in the directory ./data
in the
Further links
http://beagle.vpro.nl
http://www.stadamsterdam.com
TU Delft Beagle website
Plots created by Hans van der Marel, TU Delft.
Last updated 19 March 2010.